


1. Introduction
Dense non-aqueous liquids (DNAPLs) are hazardous organic chemicals widely used in industrial processes and include chlorinated solvents, creosotes, coal tar, and poly- chlorinated biphenyls, which are frequently detected in soil and groundwater (Feng et al., 2023a). Chlorinated solvent such as tetrachloroethylene (PCE) has been widely used as an industrial solvent for degreasing metal parts, paint stripping, and plastics production, dry clean fabrics and manufacture other chemicals resulting in significant conta- mination of groundwater and soil by chlorinated organic compounds (COCs) (Yin et al., 2022). PCE is a toxic chemical due to its cytotoxicity, carcinogenicity, and per- sistence in the hyporheic zone and groundwater that may pose serious human health and environmental concerns (Liu et al., 2022). It has been included to the US Environmental Protection Agency's (USEPA) Priority Pollutant List as one of 14 volatile organic compounds (Sekar et al., 2022). As a result, researchers are very interested in developing treat- ment technologies for PCE in the hyporheic zone and groundwater. In the field of environmental technology, hyporheic zones and PCE-contaminated groundwater have also consistently attracted attention.
Chlorinated organic pollutants in aquatic systems have been treated by physical, biochemical, and chemical pro- cesses. Although technologies based on membranes (Rani and Karthikeyan, 2021), extraction (Akinpelu et al., 2019), ozonation (Li et al., 2021), biodegradation (Feng et al., 2023b) and advanced oxidation processes (AOPs) (Al-Masud et al., 2022; Masud et al., 2022) are highly efficient, the operational costs are high. To remove organic pollutants from aquatic environment, sorption is one of the main physical processes (Brusseau et al., 2012; Choi and Shin, 2020). However, the types of adsorbents are crucial for the effectiveness of adsorption toward particular pollutants (Kim et al., 2005; Xiao and Huang, 2011). Under anaerobic conditions, reductive dichlorination is carried out biologi- cally by dehalococcoides and chemically by Fe 0 (Devore et al., 2022; Dutta et al., 2022).
Sorption is the most important processes controlling interaction between hydrophobic organic contaminants and soils/sediments (Prajapati et al., 2022). Numerous studies have shown that the fate and transport of hydrophobic organic compounds (HOCs) in soil is highly dependent on sorption/desorption characteristics (Christensen et al., 2022). A few studies have reported on the application of solubility-normalized model to explain nonlinear sorption of HOCs in soils and sediments (Allen-King et al., 2002; Carmo et al., 2000; Kleineidam et al., 2002; Masud and Shin, 2022; Qi et al., 2004; Ran et al., 2004). The purpose of this study is to investigate the sorption and desorption behaviors of PCE in several natural sorbents. An accurate estimation of sorption may have wide implications on the remediation of HOCs in natural environments. In this paper, sorption/desorption characteristics of PEC in natural sorbents with wide range of organic carbon content.
This study examines the details of the sorption of PCE on four different sorbents, i.e., Pahokee peat, vermicompost, BionSoil ® , and natural soil through batch experiments. The sorption behaviors of PCE in natural sorbents were analyzed using several models such as linear, Freundlich, solubility-normalized Freundlich and Polanyi-Manes (PM) models. The objectives of this study were to compare the sorption of different sorbents and compare different models for sorption with sorbents. The relationship between sorption model parameters, organic carbon content ( foc ), and elemental C/N ratio was studied.
2. Materials and Methods
2.1. Chemicals
Radiolabeled [1,2- 14 C] PCE (ChemSyn Laboratories, 2.2 mCi/mmol, >99.9%) were obtained from ARC chemicals (Saint Louis, MO, USA) and used as radiotracers (Kan et al., 1998, 1997). The [ 14 C] compounds were further diluted with unlabeled tetrachloroethylene (PCE, >99.9%, HPLC grade, Sigma-Aldrich, Germany) stock solutions (1,000 mg L -1 in methanol, HPLC grade, Sigma-Aldrich, Germany) to yield desired concentrations. Sodium azide (NaN 3 , 99%, Daejung Chemical Co., Siheung, Korea) was added to the solution as a bacterial inhibitor. PCE solution was prepared before each sorption experiment using the 14 C stock solution. The physicochemical properties of PCE are sum- marized in Table 1 . Electrolyte solution used in experiments was prepared in distilled and deionized water (DDI, MilliporeSigma™ Synergy™, Thermo Fisher Scientific, Waltham, MA, USA) containing 1.0 mM of CaCl 2 ·2H 2 O (99%, Daejung Chemical Co., Siheung, Korea), 0.5 mM of MgCl 2 , (98%, Duksan, Ansan, Korea) and 1 mM Na 2 B 4 O 7 · 10H 2 O (98%, Duksan Chemical Co., Ansan, Korea).

2.2. Sorbents
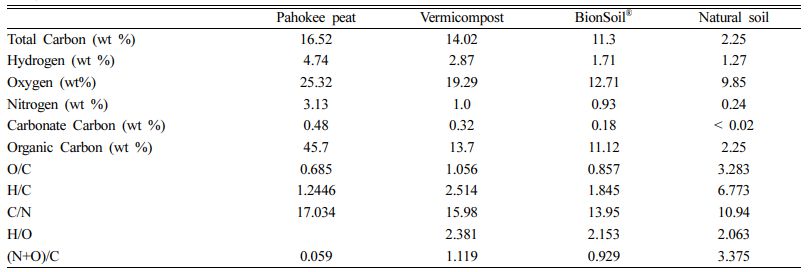
Four different carbon-based sorbents such as Pahokee peat (International Humic Substances Society, USA), BionSoil ® (Bion Environmental Technologies, Inc., USA), vermicom- post (Eco Biotech, Korea), and a natural soil (collected from a local horizon near Daegu, Korea) were chosen for to investigate the sorption behavior of PCE. The sorbent characteristics analyzed by Huffmann Laboratories; Inc. (Golden, CO, USA) was listed in Table 2 . The organic carbon content ( foc ) was in the order of Pahokee peat (44.6 wt%) > vermicompost (13.7 wt%) > BionSoil ® (11.12 wt%) > natural soil (2.25 wt%). The sorbent samples were air-dried, sieved through a U.S. Sieve Series No. 20 sieve and kept in gas-tight amber bottle until use.
Table 2
Summary of soil characteristics analyzed by Huffman Laboratories, Inc. (Golden, CO, USA). Data indicates percentage per g of dry soil
2.3. Experimental procedures
Sorption experiments were conducted using 40-mL amber vials (Fisher Co.) with open-top polypropylene screw thread caps with Teflon-faced silicon septa (Kimble Chase, USA). Different weights (g) of sorbents are used in this study because sorbents have widely different sorption capacities. Predetermined amounts of sorbents such as Pahokee peat (0.02 g), vermicompost (0.03 g), BionSoil ® (0.03 g) and natural soil (0.1 g), were transferred to the vial before the addition of PCE solution. To obtain sorption isotherms, eight different initial concentrations (from 10 mg L -1 to 100 mg L -1 ) of PCE solution were used. The vials containing the sorbent was filled with the spiking solution minimizing the heads- pace. Control vials without sorbents were also prepared in duplicate. The mixture was horizontally mixed at 150 rpm on an orbital shaker at room temperature. After 2 days, the soil was separated from the solution by centrifugation at 2,500 rpm for 20 minutes. 1.0 mL of the supernatant was mixed with 10 mL of scintillation cocktail (Ultima Gold, Sigma) and the radioactivity was analyzed by liquid sci- ntillation counter (LSC, EG&G Wallac Co., 1220 Quantulus). Approximately 95% of the supernatant was gently removed using a pipette and spiked with solute-free electrolyte solution for sorption. The actual amount of supernatant removed and added was determined gravimetrically. After 2 days, the sorbent/water mixture was centrifuged at 2,500 rpm for 20 minutes and the radioactivity of the supernatant was analyzed. The sorbed PCE concentrations were calculated by assuming all concentration changes in solution phase result from sorption onto the solid phase. All experiments were run in duplicate.
2.4. Sorption models
2.4.1. Linear Model
Linear sorption model was used to analyze sorption and desorption isotherms:

where q (mg/kg) is total concentration of sorbed compound in the soil phase, Kp (L/kg) is linear partition coefficient, C (mg/L) is chemical concentration in solution phase, K oc (= K p / f oc , L/kg OC) is organic carbon normalized partition coefficient, and f oc is organic carbon content, respectively.
To evaluate the relative sorption affinity of PCE in the sorbents, sorption affinity ratio (SAR) is defined as:

where q|C and q min |C are the solid phase concentration of a sorbent and that of a sorbent with minimum sorption affinity (natural soil) at aqueous phase concentration C , respectively. The K d and K d, min are the distribution coefficient of each sorbent, respectively.
2.4.2. Freundlich Model
Freundlich model was also used to fit the sorption and desorption data:

where KF [(mg/kg)/(mg/L) N ] and NF (dimensionless) are Freundlich sorption coefficient and the Freundlich exponent and K F , oc [(mg/kg OC)/(mg/L) N ] is organic carbon normalized Freundlich sorption coefficient, respectively.
2.4.3. Solubility-normalized Freundlich model
In this study, a solubility-normalized Freundlich model was used to fit the single-solute sorption data (Allen-King et al., 2002; Carmo et al., 2000; Kile et al., 1999):

where S (mg/L) is the solute’s aqueous solubility, K 'F (mg/kg) is the unit-normalized Freundlich sorption coefficient and K 'F (mg/kg OC) is organic carbon normalized form of K 'F . The use of C/S yields that K 'F values are inde- pendent of the values of NF . In Eq. (3), K 'F has the same units as q and its magnitude is equal to the value of q at C/S = 1. Thus K 'F represents the mass of HOC sorbed per unit mass of sorbent when the C approaches saturation ( C → S ), regardless of the units of C . This approach implicates that the unit-normalized Freundlich sorption coefficient (K 'F ) has both physical significance and meaningful units in addition to providing a flexible choice of units for C .
2.4.4. Polanyi-Manes model (PMM)
Polanyi-Manes (PDM) model was also used to fit sorption data (Allen-King et al., 2002; Carmo et al., 2000; Chiou and Kile, 1998; Kile et al., 1999):

where q max is the maximum sorption capacity (mg/kg), a and β are fitting parameters, V m is the molar volume of the solute (L/mol) and εsw is the solute sorption potential (= RT ln( S/C )). To decrease the number of parameters to be esti- mated, b was fixed to be 2.0 (Kleineidam et al., 2002):

The sorption model parameters were determined by using a commercial software package, Table Curve 2D ® (Version 5.1, SPSS, Inc.).
3. Results and Discussion
3.1. Sorption isotherm
The relationship between elemental ratios of natural sorbents: H/C, (N+O)/C and C/N versus O/C was shown in Fig. 1 . The H/C, (N+O)/C ratios are linearly increasing with O/C ratio, whereas linearly decreasing with C/N ratio.
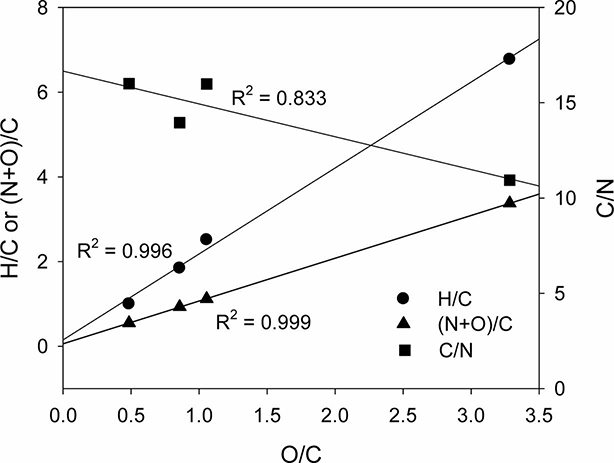
Fig. 1
The relationship between elemental ratios of several sorbents: H/C, (N+O)/C and C/N versus O/C.
The sorption isotherm of PCE on natural sorbents was presented in Fig. 2 . The linear, Freundlich, and solubility-normalized Freundlich models were fitted well to the sorption data (0.947 < R 2 < 0.996). As listed in Table 3 , the log Koc value was in the order of natural soil > vermi- compost > Pahokee peat > BionSoil ® for sorption of PCE. The log K oc values (1.50-3.13) in four different sorbents were less than log K ow (= 3.40) of PCE. The order of increase in log K oc value was not correlated with the log-transformed organic carbon content (log f oc ), atomic ratios (log O/C, log C/N log H/C, and log (N+O)/C). The difference in log K oc value of the soils is presumably due to diagenetically altered soil properties; diagenetically ‘older’ organic carbon appears to cause stronger bonding in the natural soil (Cornelissen et al., 2005, 2004).
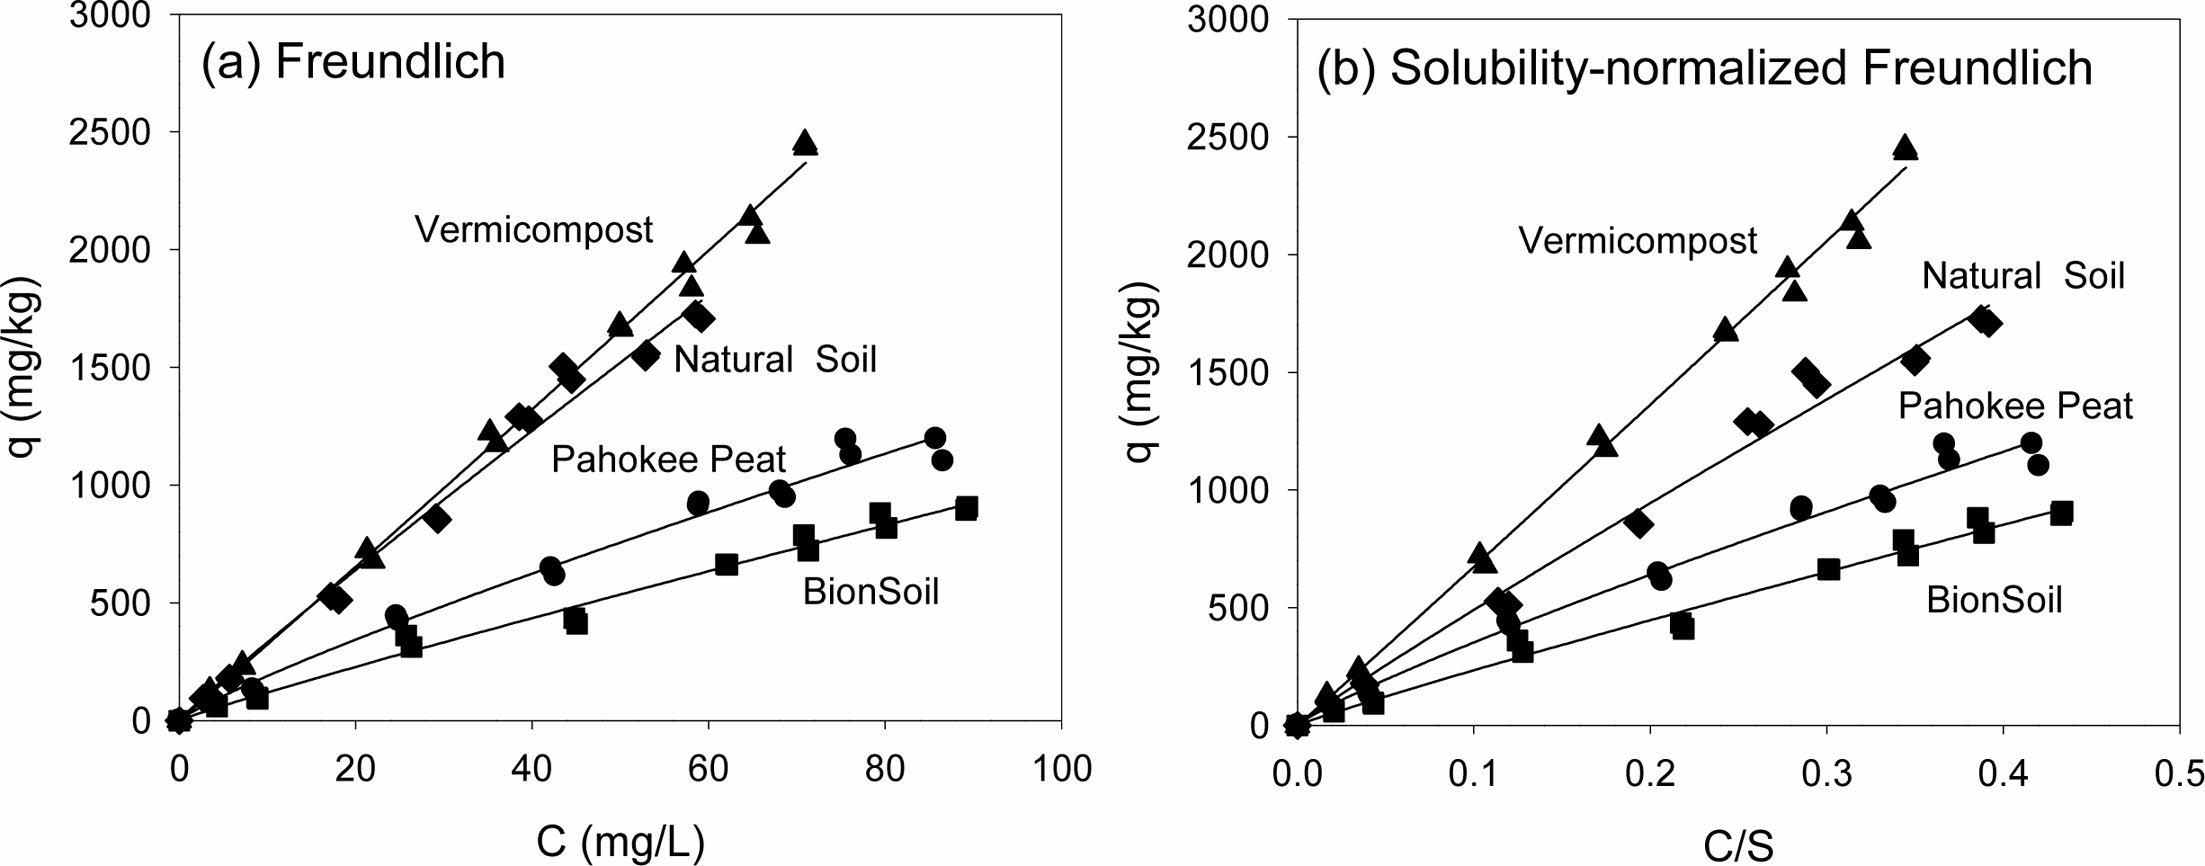
Fig. 2
Sorption isotherms of PCE in several sorbents. (a) Freundlich and (b) solubility-normalized Freundlich isotherm
Table 3
Linear model parameters for PCE sorption in several sorbents. ( K oc = organic carbon normalized partition coefficient)

As listed in Table 3 , the SAR was in the order of natural soil = vermicompost > Pahokee peat > BionSoil ® . This suggests that diagenetically ‘older’ natural soil has higher SAR than the others.
The relationships between the log K oc vs. log f oc and log-transformed atomic ratios (log C/N, log O/C, log H/C and log (N+O/C)) were shown in Fig. 3 . The log K oc decreased linearly with log f oc and log C/N ratio. In contrast, the log K oc increased linearly with log O/C, log H/C and also log (N + O)/C ratio (Fig. 3 ).
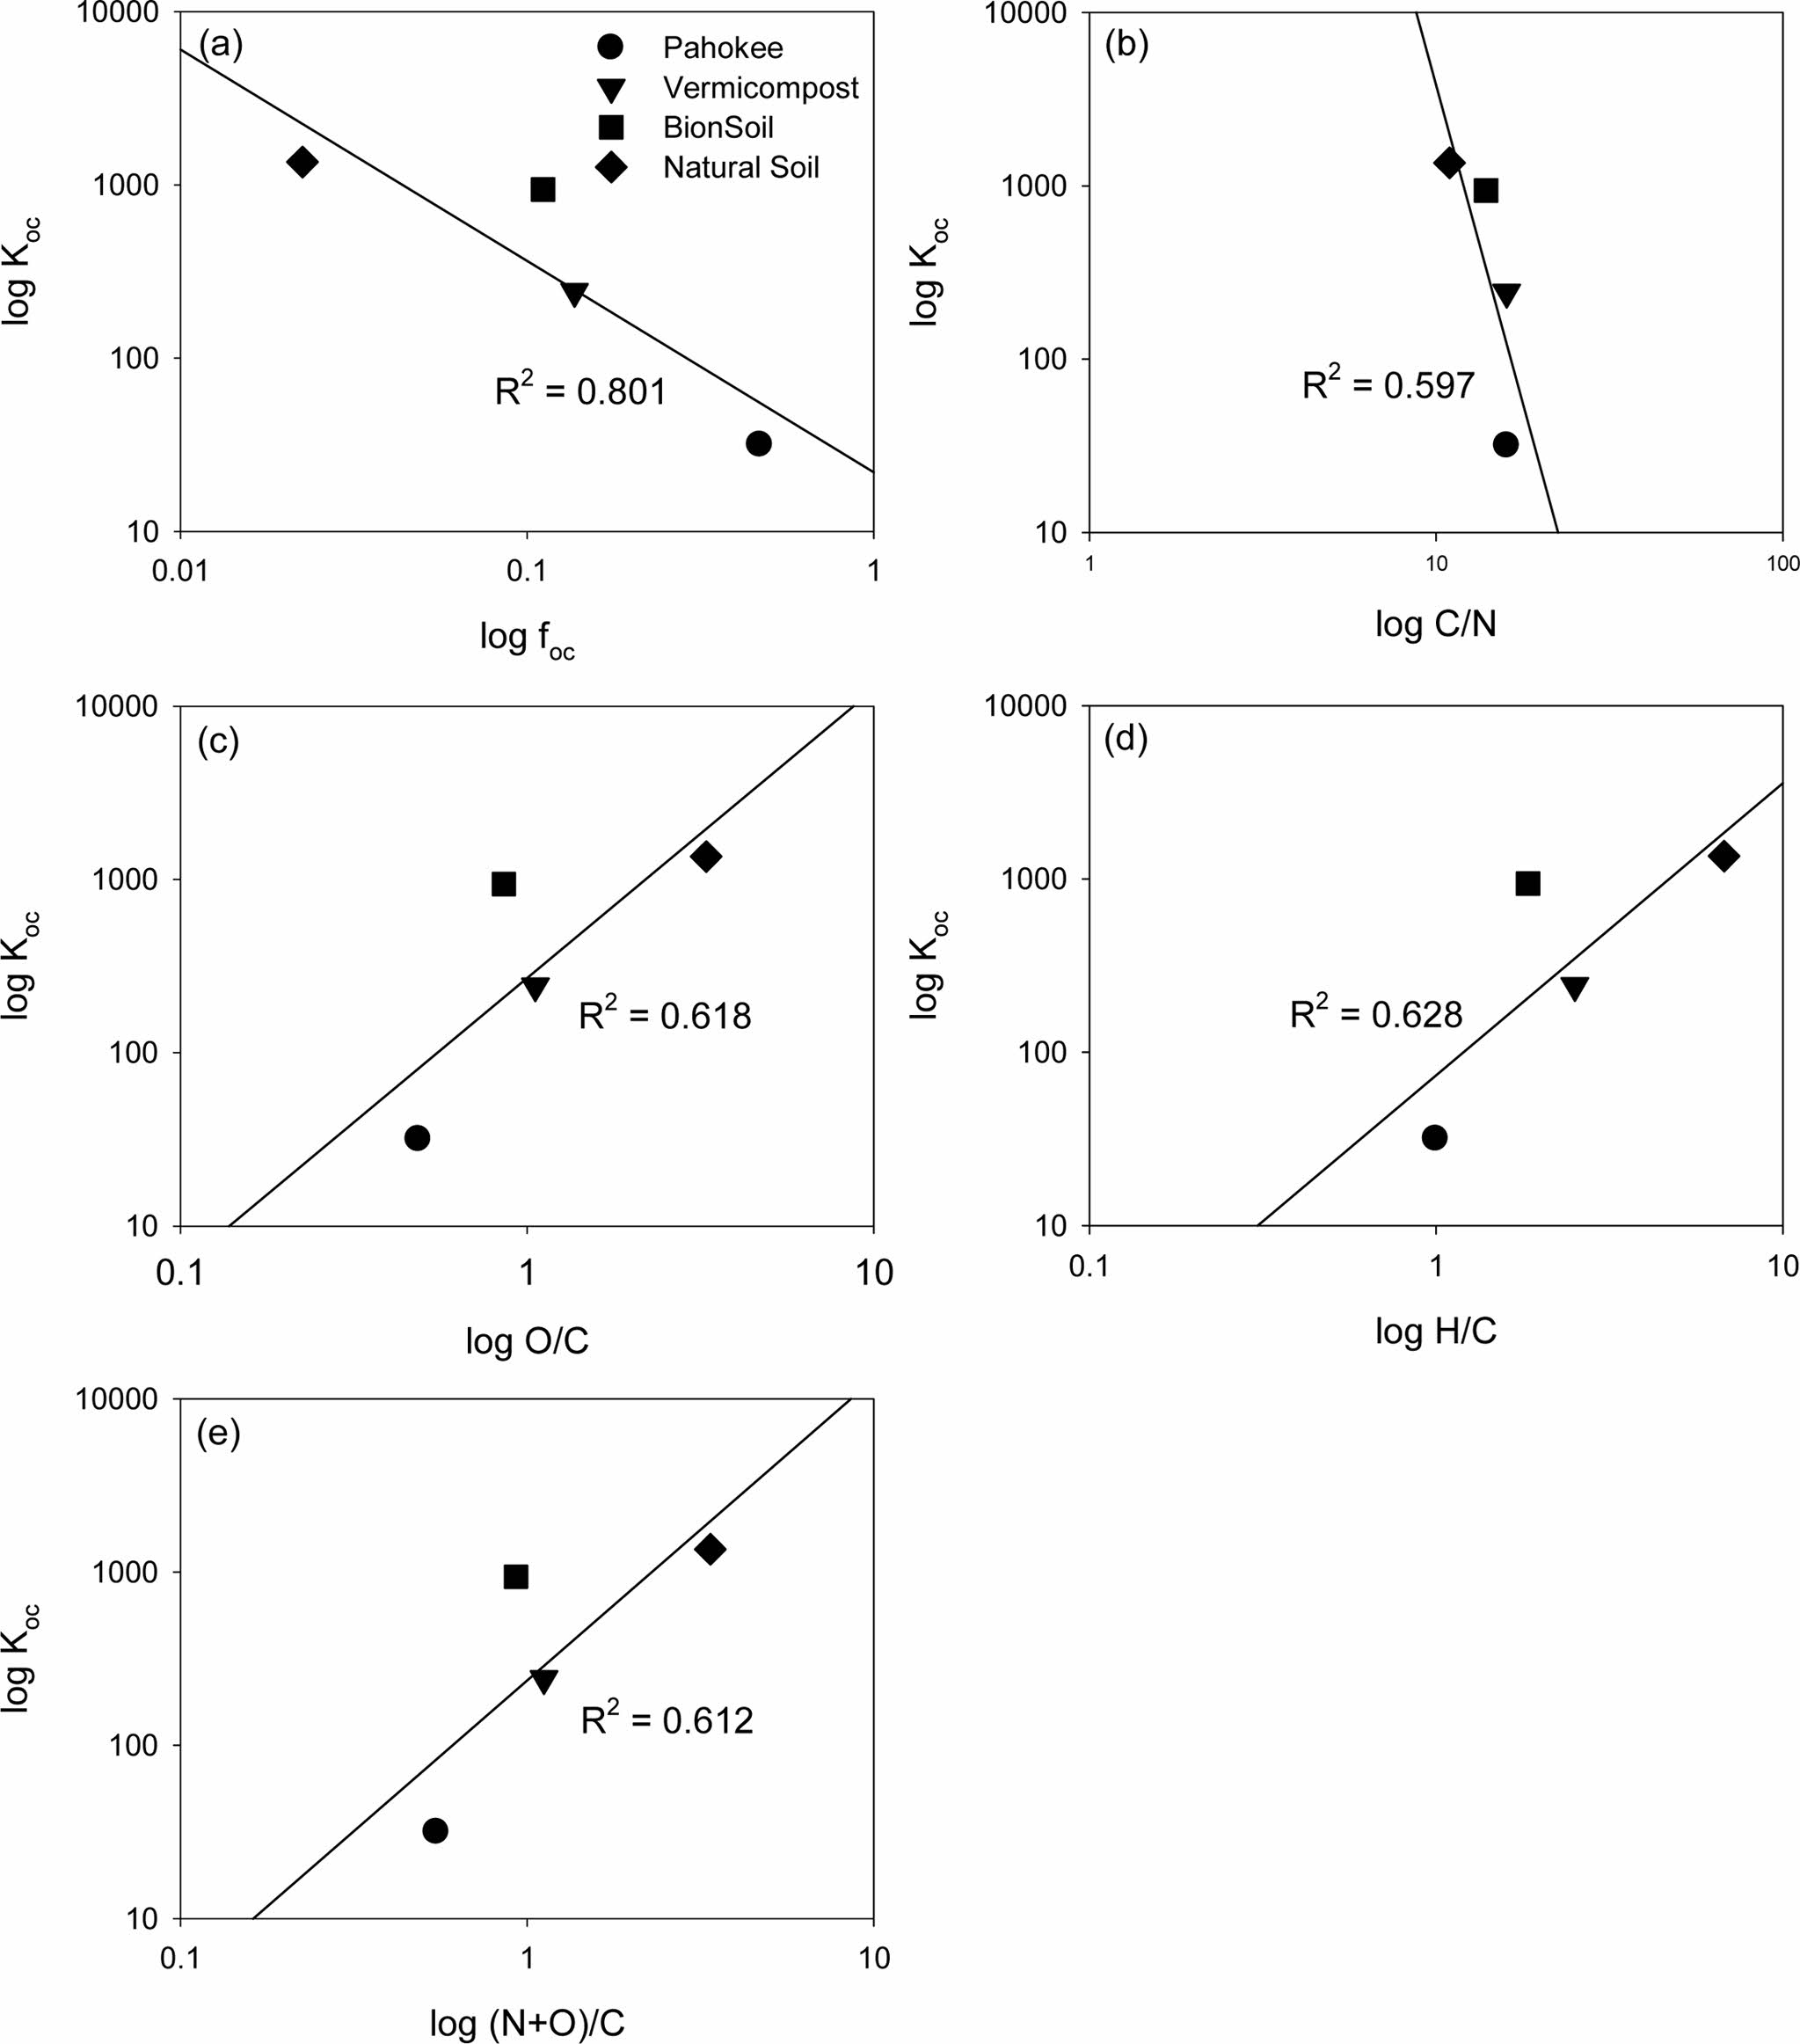
Fig. 3
Relationship between linear sorption model parameter (K oc ) and organic carbon content ( f oc ) or elemental ratios (C/N, O/C, H/C, and (N+O)/C)
3.2. Freundlich and Solubility-normalized Freundlich model
The Freundlich model parameters are listed in Table 4 . As indicated by the R 2 values (0.950–0.996), the Freundlich model fitted well to the sorption data. The Freundlich sorption constant, K F , indicating the sorption capacity of the sorbent was in the order of natural soil > vermicompost > Pahokee peat > BionSoil ® for sorption. The organic carbon-normalized Freundlich coefficient ( K F,oc ) was also in the order of natural soil > vermicompost > Pahokee peat > BionSoil ® .

As indicated by the NF values (0.93–1.02) of the Freun- dlich model, sorption of PCE were nearly linear, except Pahokee peat (0.86). The Freundlich exponent, NF ,is a measure of the deviation from linearity of the sorption. If a value for NF is equal to unity, the sorption is linear (Choi and Shin, 2020; Shin and Song, 2005). If NF value is above 1, this implies that sorption process is chemical, but if NF value is below 1, sorption is favorable, a physical process (Masud et al., 2023). The NF values at equilibrium represent favo- rable sorption, and therefore this would seem to suggest that physical, which is referred the sorption bond becomes weak and conducted with van der Waals forces (Özcan et al., 2006). As listed in Table 4 , PCE sorption was favorable in Pahokee peat, BionSoil ® , and natural soil (i.e., NF < 1), except vermicompost that showed NF value slightly above 1.
As listed in Table 5 , the solubility-normalized Freundlich coefficient ( K 'F ) was in the order of vermicompost > natural soil > Pahokee peat > BionSoil ® . The advantage of the solubility-normalized Freundlich model is that the K 'F value represents the mass of HOC sorbed per unit mass of sorbent when the C concentration approaches saturation ( C → S ), regardless of the units of C . The effect of sorbate charac- teristics on sorption is clearly evident at low equilibrium concentrations. To examine this, the q value for an arbitrary value of C = 20 mg/L ( q| C=20 ) was calculated by using Eq. (4) and the unit-normalized Freundlich sorption coefficients ( K 'F and K 'F,oc ) listed in Table 5 . The calculated q| C=20 values for PCE were in the order of vermicompost > natural soil > Pahokee peat > BionSoil ® . When organic carbon normalized, the K 'F,oc was in the order of natural soil >> vermicompost > BionSoil ® > Pahokee peat. This explains that geologically weathered soil (i.e., natural soil) has higher K 'F,oc value and thus higher qe (mg/kg OC) value.

The relationships between the log K F,oc or log K 'F,oc vs. log f oc and log-transformed atomic ratios (log C/N and log (N+O/C)) were shown in Fig. 4 . Both log K F,oc or log K 'F,oc decreased linearly with log f oc (R 2 = 0.88-0.92) and log C/N ratio (R 2 = 0.57-0.76), but increased linearly with log (N + O)/C (R 2 = 0.93-0.95).
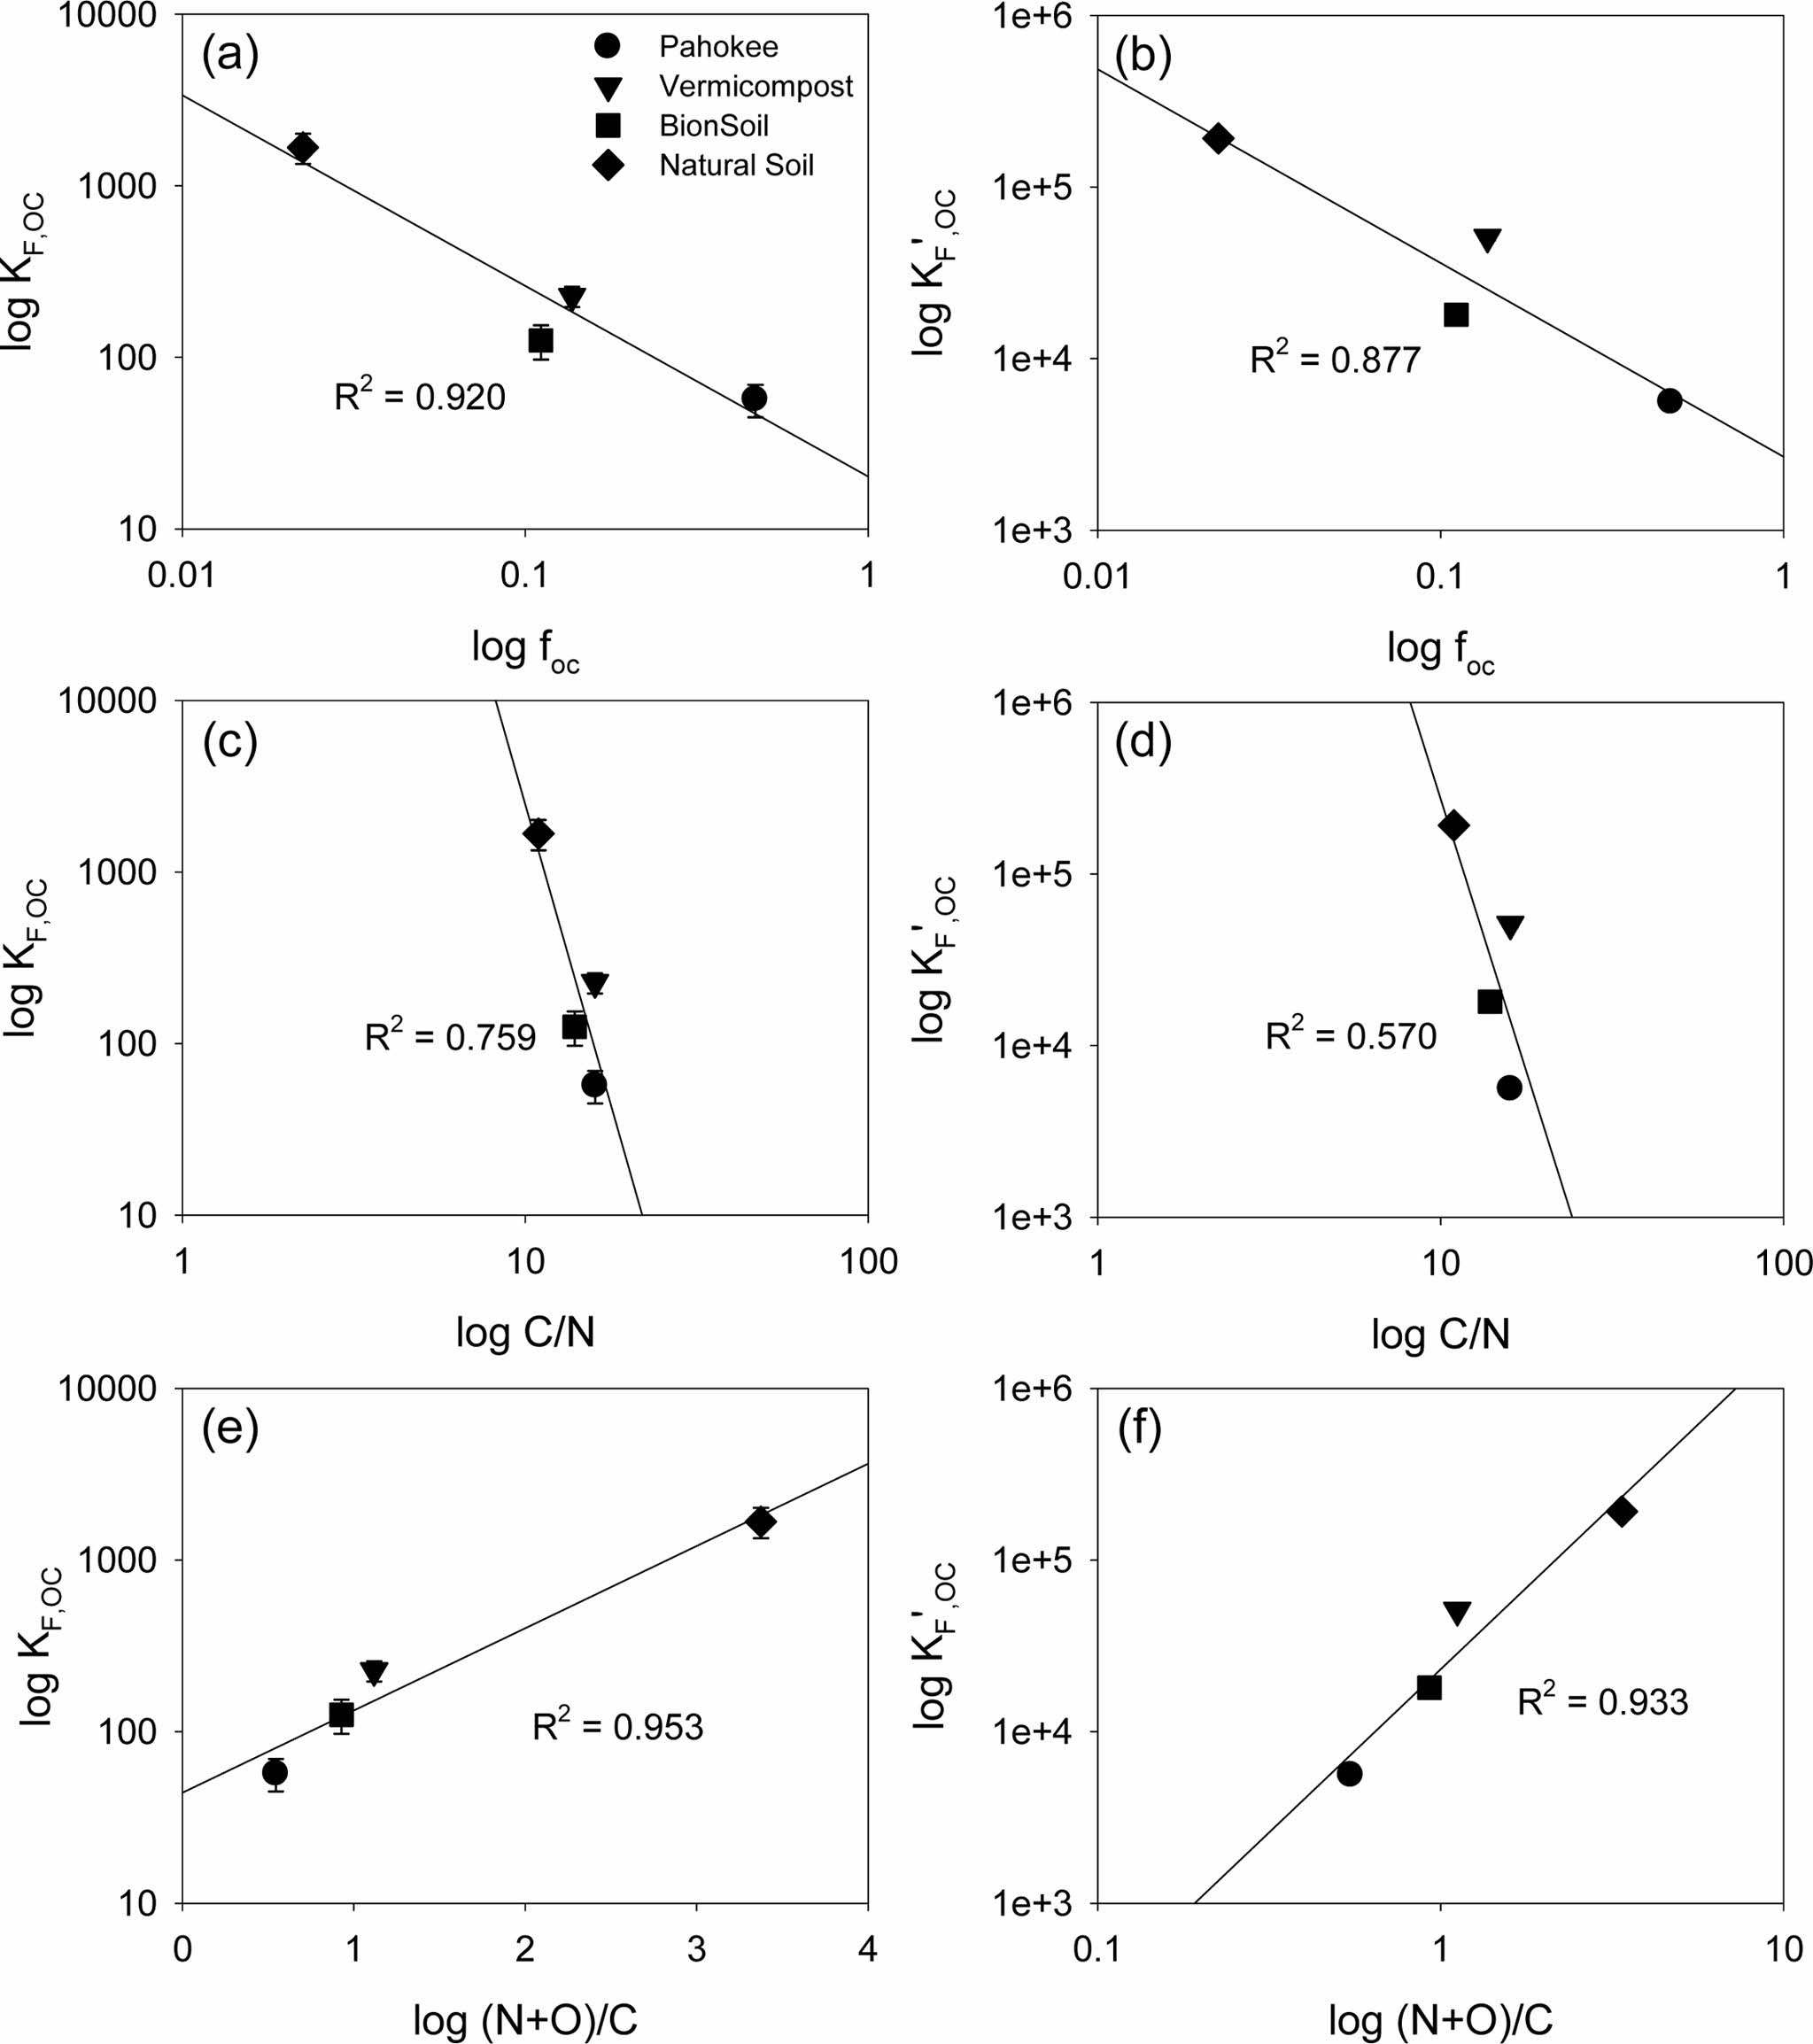
Fig. 4
Relationship between organic carbon-normalized Freundlich ( K F,oc ) and solubility-normalized Freundlich ( K 'F,o c ) sorption coefficients and organic carbon content ( f oc ) or elemental ratios (C/N and (N+O)/C).
3.3. Polanyi-Dubinin-Manes (PDM) model
The results of PDM model analysis are listed in Table 6 . The maximum sorption capacity ( q max ) was in the order of vermicompost > natural soil > Pahokee peat > BionSoil ® . The organic carbon-normalized maximum sorption capacity ( q max,oc ) was in the order of natural soil > vermicompost > Pahokee peat > BionSoil ® . In addition, q max,oc rather than q max was able to explain higher maximum sorption capacity in geologically ‘older’ soil. The relationships between log q max,oc and log f oc and log-transformed elemental ratios (log C/N, log O/C, log H/C and log (N+O)/C) were shown in Fig. 5 . The log q max,oc decreased linearly as log f oc and log C/N increased, whereas increased with log O/C, log H/C and log (N+O)/C ratios. The log q max,oc increased linearly with (N+O)/C indicating that a strong dependence of q max,oc on the polarity index.

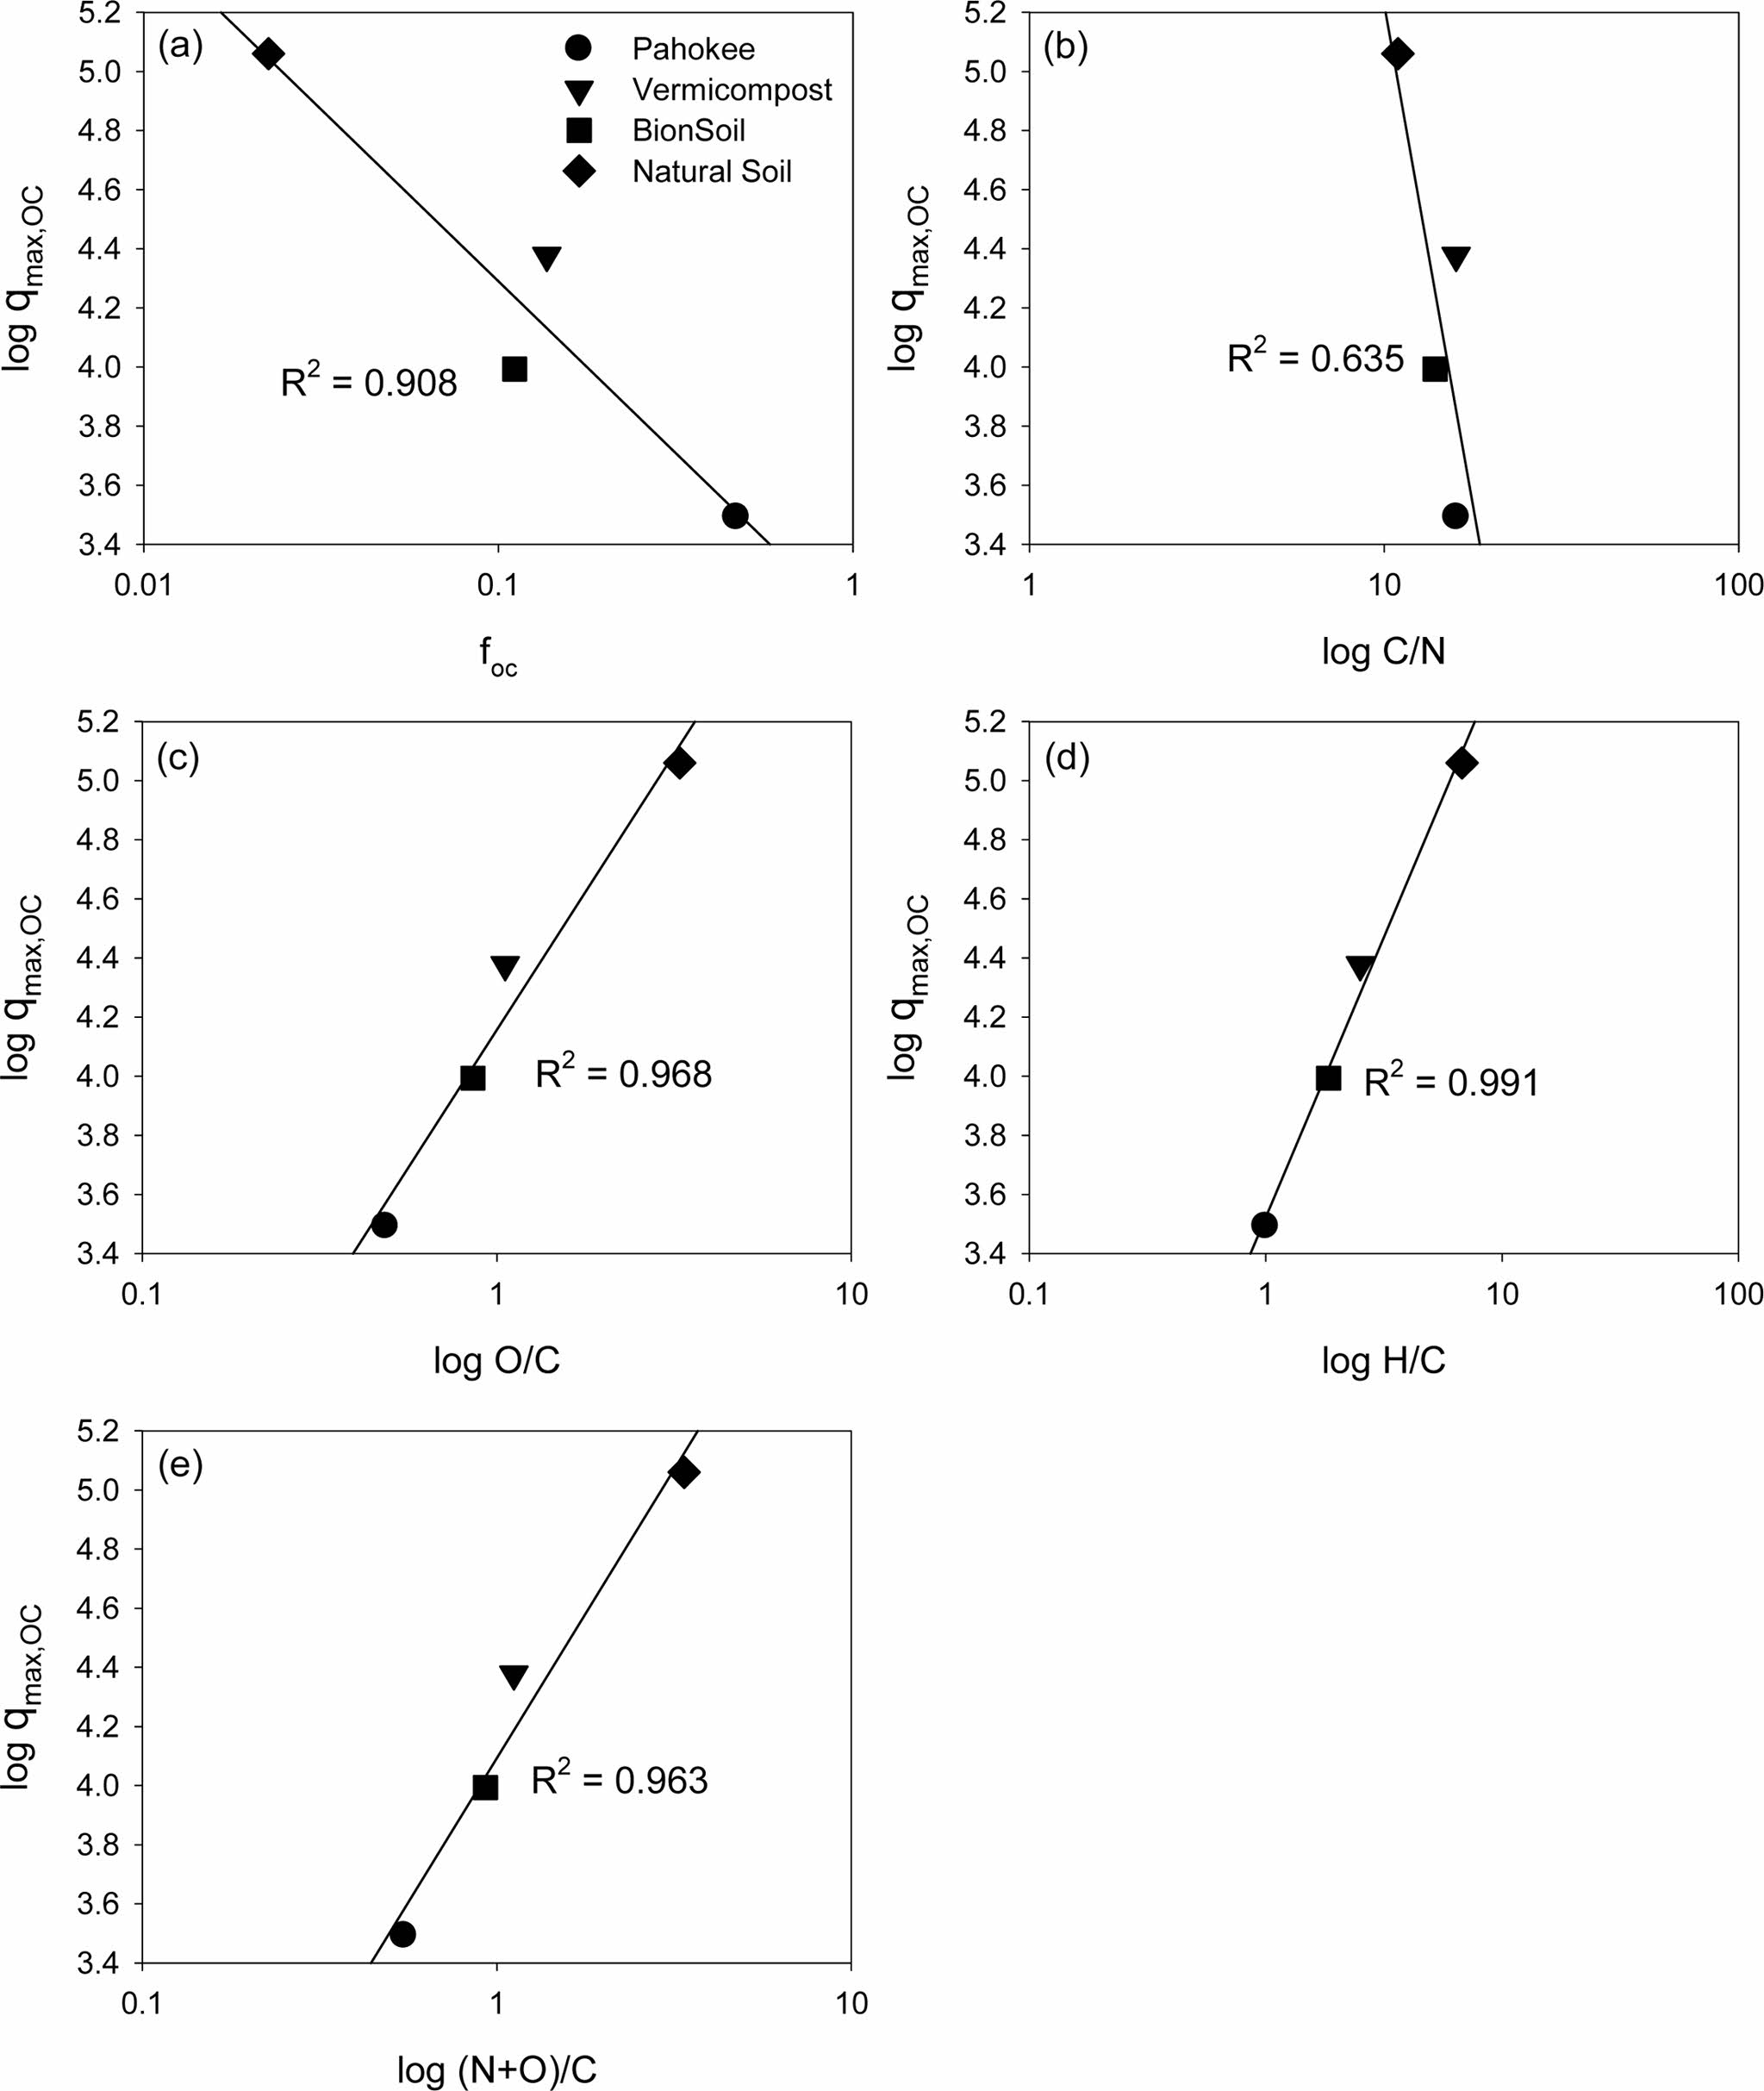
Fig. 5
Relationship between PDM parameter (q max,oc ) and organic carbon content ( f oc ) or elemental ratios (C/N, O/C, H/C, and (N+O)/C).
3.4. Solubility normalization
As shown in Fig. 6 , provides the relationship between q / foc versus C/S for PCE sorption onto the sorbents. If Eq. (3) and Eq. (4) are normalized by organic carbon content (Allen-King et al., 2002; Shin and Song, 2005):
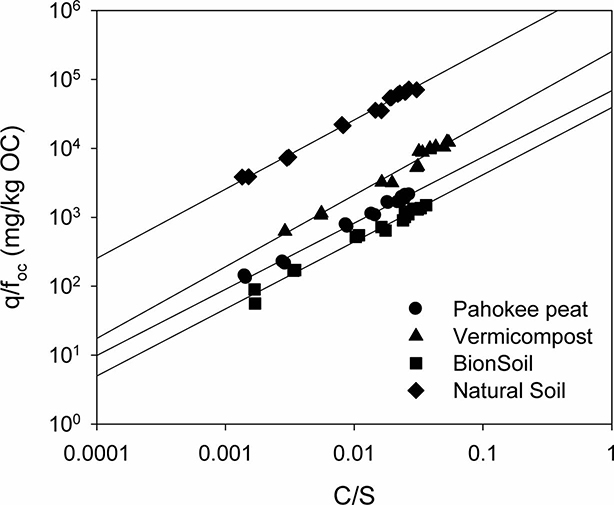
Fig. 6
Relationship between q/f oc (= /f oc ) and C/S for sorption of PCE in natural sorbents. Note that qoc/f oc = /f oc as concentration approaches solubility (C/S → 1).

As concentration approaches solubility ( C/S → 1), q / foc is equal to q / foc at C/S = 1 satisfying Raoult’s law. At C = S , K 'F / foc provides a measure of q at aqueous solubility (the highest possible aqueous concentration). As depicted in Fig. 6 and summarized in Table 7 , K 'F / foc (= q / foc ) at C → S was in the order of natural soil > vermicompost > Pahokee peat > BionSoil ® .

When C is very small (i.e., C → 1 mg/L), Eq. (7) becomes:

The values of K F (= K 'F S -N ) is an estimate of q at low aqueous concentration satisfying Henry’s law. Then the solubility-normalized Freundlich isotherm elucidates that the relationship between K F (at C = 1 mg/L) and S N . As shown in Fig. 6 and summarized in Table 7 , K 'F / foc (= q / foc ) at C → 1 mg/Lwas also in the order of natural soil > vermicompost > Pahokee peat > BionSoil ® , consistent with the order at C → S . In addition, the order of increases in K 'F / foc values at both C → S and C 1 mg/Lwere consistent with K 'F,oc and q max,oc . Therefore, it is concluded that solubility-normali- zation is useful in elucidating sorption capacities in soils with widely different characteristics (i.e., foc and elemental ratios).
4. Conclusions
Sorption characteristics of PCE in several sorbents with widely different organic carbon contents were investigated. To characterize the sorption behaviors of PCE, four different models were used, i.e., linear, Freundlich, solubility-normalized Freundlich, and Polanyi-Manes. The parameters of the sorption model, the organic carbon content ( f oc ), and the elemental C/N ratio were investigated. Due to the high organic carbon contents, the log K oc values in four distinct sorbents were lower than the log K ow of PCE. The log K oc decreased linearly with log f oc and log C/N ratio, but increased linearly with log O/C, log H/C and also log (N+O)/C ratio. Both log K F,oc or log K 'F,oc decreased linearly with log f oc and log C/N ratio, butincreased linearly with log (N+O)/C. The log q max,oc decreased linearly as log f oc and log C/N increased, whereas increased with log O/C, log H/C and log (N+O)/C ratios. The log q max,oc increased linearly with (N+O)/C that a strong dependence of q max,oc on the polarity index. For a better mechanistic explanation of the sorption behavior of PCE onto Pahokee peat, vermicompost, BionSoil ® , and natural soil sorbents, it is necessary to analyze Brunauer-Emmett-Teller (BET), Fourier transform infrared spectroscopy (FTIR), X-ray photoelectron spectroscopy (XPS), and X-ray diffraction (XRD) analysis, as suggested in the further study.

