


1. Introduction
An analysis of groundwater quality is indispensable for monitoring and managing water contamination and ground-water system. For the purpose of those, the geochemical characteristics of groundwater in Haean-Myun, Yanggu-Gun, Gangwon-Do in Korea were studied over the concern for water quality, water type and origin of nitrate nitrogen. Water samples were collected from 22 rockbed and 11 allu-vial wells. The analysis was categorized by general items, anions and cations, and isotopic fractionation of nitrogen.
2. Experiments and Assesment
Well type and analysis items for 33 wells were shown in Table 1. For analyzing isotopic fractionation of nitrogen (δ15N), samples from 8 alluvial and 11 rockbed wells were selected by reference data provided by Korea Rural Com-munity Corporation. General analysis items include total colony counts, total coliforms, pH, EC and NO3-N and Ca2+, K+, Mg2+, Na+, Cl−, SO42−, CO32−, and HCO3− ions, and isotope of nitrogen were analyzed.
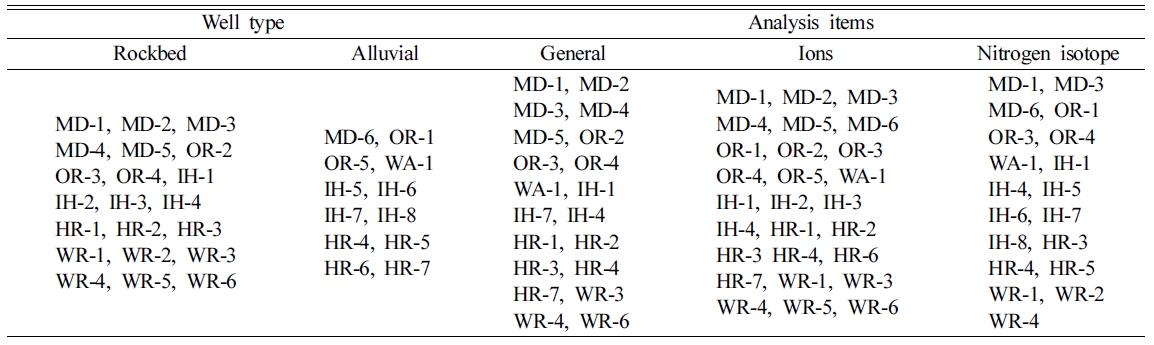
Water samples for analysis were classified in 3 catego-ries; general items, cation and anion, and nitrogen isotope. 1~2 L of groundwater was sampled approximately after 5 minutes pumping from the well to obtain fresh groundwa-ter. pH and EC were measured in-situ according to Experi-mental Standards of Water Pollutants (Ministry of Environ-ment, 2001). And water samples, exclusive of total coli-forms analysis, were pretreated and refrigerated to be deliv-ered to laboratory. Multiple tube fermentation technique is applied to analyze total coliforms (Korean standard method of drinking water quality test (ES 05703.1a). For the cation analysis, in-situ filtering was carried out using 0.45 µm membrane filters, and HNO3 was added to maintain pH below 2. For anion and nitrogen isotope analysis, the same kind of filters were used. Ion concentration was analyzed ICP-OES (Vista-MPX, Varian) and IC (761, Metrohm) according to SW-846 6010A (EPA) and Standard Methods 4110 (AWWA, 18th Ed., 1992), respectively. For analysis of isotopic fractionation of nitrogen (δ15N), 500 ml of pre-treated, airtight and refrigerated samples were delivered to national instrumentation center for environmental manage-ment (NICEM) in Seoul national university.
Origin of nitrogen in groundwater has been investigated by many researchers (Power et al., 1974; Boyce et al., 1976; Holloway et al., 1998; Kreiter et al., 1978). NO3-N contam-ination of goundwater is attributed by chemical fertilizer, livestock manure and domestic sewage, and natural soil (Oh and Hyun, 1997; Choi et al., 2003). And natural nitrate is associated with rock type, natural and atmospheric environ-ments, and other parameters (Power et al., 1974; Mike Lowe and Janae Wallace, 2001). And nitrogen concentra-tion can also be affected by biochemical and biological transformation. Because, these processes can influence the release of nitrogen in bedrock into ground water (Holloway and Smith, 2000). The relationship between nitrate nitrogen (NO3-N) and isotopic fractionation of nitrogen (δ15N) was analyzed to estimate origin of nitrogen.
Two types of hydrogen stable isotopes, 14N and 15N, exist in nature, and isotopic fractionation of nitrogen (δ15N) can be obtained by quantified 15N and 14N using equation below.

Higher δ15N implies that heavier 15N exists more than 14N while lower δ15N implies that 14N exists more than 15N in the sample. To evaluate the nitrate contamination source in groundwater using δ15N technique, it is more reasonable to use correlation between the NO3-N concentrations and δ15N. From this technique, δ15N ranges of chemical fertil-izer, livestock manure and domestic sewage, and natural soil are –4 ~ +4‰, –10 ~ +22‰, +6 ~ +10‰ and –4 ~ +8‰, respectively (Heaton, 1986, Komor and Anderson, 1993). The component ratio of nitrate nitrogen from differ-ent sources can be estimated by the following relations (Nakanishi, 1995; Yamamoto et al., 1995; Jeong, 2003). Sources of nitrate nitrogen using δ15N can be estimated by following relations.
W = X + Y + Z
aW = bX + cY + dZ
where,
W: NO3-N concentration in groundwater (mg/L)
X: NO3-N concentration originated by chemical fertilizer (mg/L)
Y: NO3-N concentration originated by livestock manure and domestic sewage (mg/L)
Z: NO3-N concentration originated by natural soil (mg/L) a: δ15N of NO3-N in groundwater (‰)
b: δ15N of NO3-N by chemical fertilizer (‰)
c: δ15N of NO3-N by livestock manure and domestic sew-age (‰)
d: δ15N of NO3-N by natural soil (‰)
Concentration of NO3-N originated by natural soil was ranging from 0.45 mg/L to 0.9 mg/L, and the minimum of 0.45 mg/L was applied as reported by Korea Rural Commu-nity Corporation (KRC). And δ15N values of origin from chemical fertilizer, livestock manure and domestic sewage, and natural soil were 0‰, 14‰ and 1.8‰ provided by KRC.
3. Results and Discussion
3.1. General items analysis
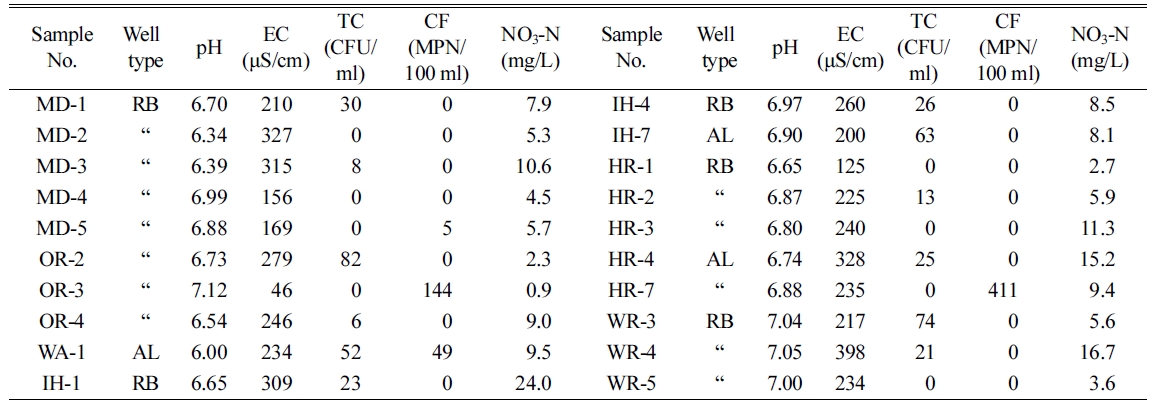
The experimental results of general items at 20 water wells were shown in Table 2. The range and average value of pH were 6.00~7.12 and 6.76, and those of electric con-ductivity (EC) were 46~398 μS/cm and 237 μS/cm. pH and EC measurements between rockbed and alluvial water showed no significant difference. Total colony counts was not detected 9 out of 20 samples, and the average value of total colony counts detected was 21.2 CFU/ml that is within Korean groundwater quality standard of less than 100 CFU/ ml. And the total coliforms were counted in MD-5, OR-3, WA-1 and HR-7 out of 20 samples. NO3-N concentrations were in the ranges of 0.9~ 24.0 mg/L, and the average value was 8.3 mg/L. It is noted that nitrate nitrogen concentration of IH-1 was 24.0 mg/L that exceeded above water quality standard. And average NO3-N values of rockbed and allu-vial water were 7.9 mg/L and 10.6 mg/L. In general, notice-able results were not identified.
3.2. Ion analysis
Cation and anion concentrations from 23 rockbed and 7 alluvial water were analyzed, and summarized in Table 3.
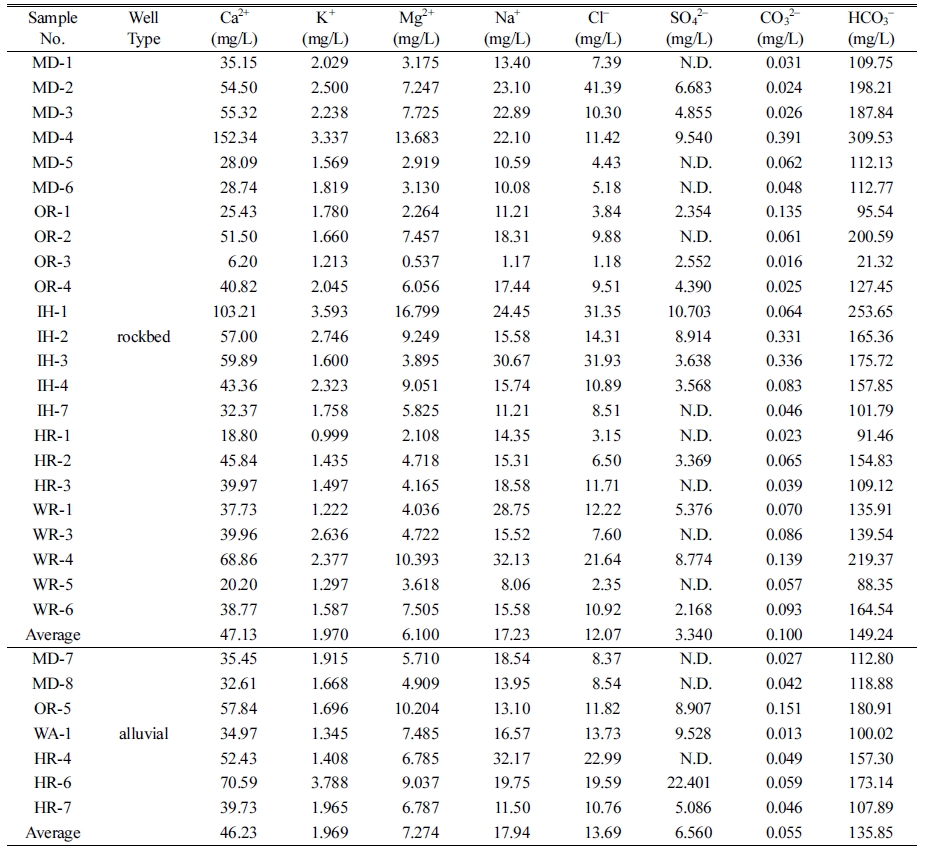
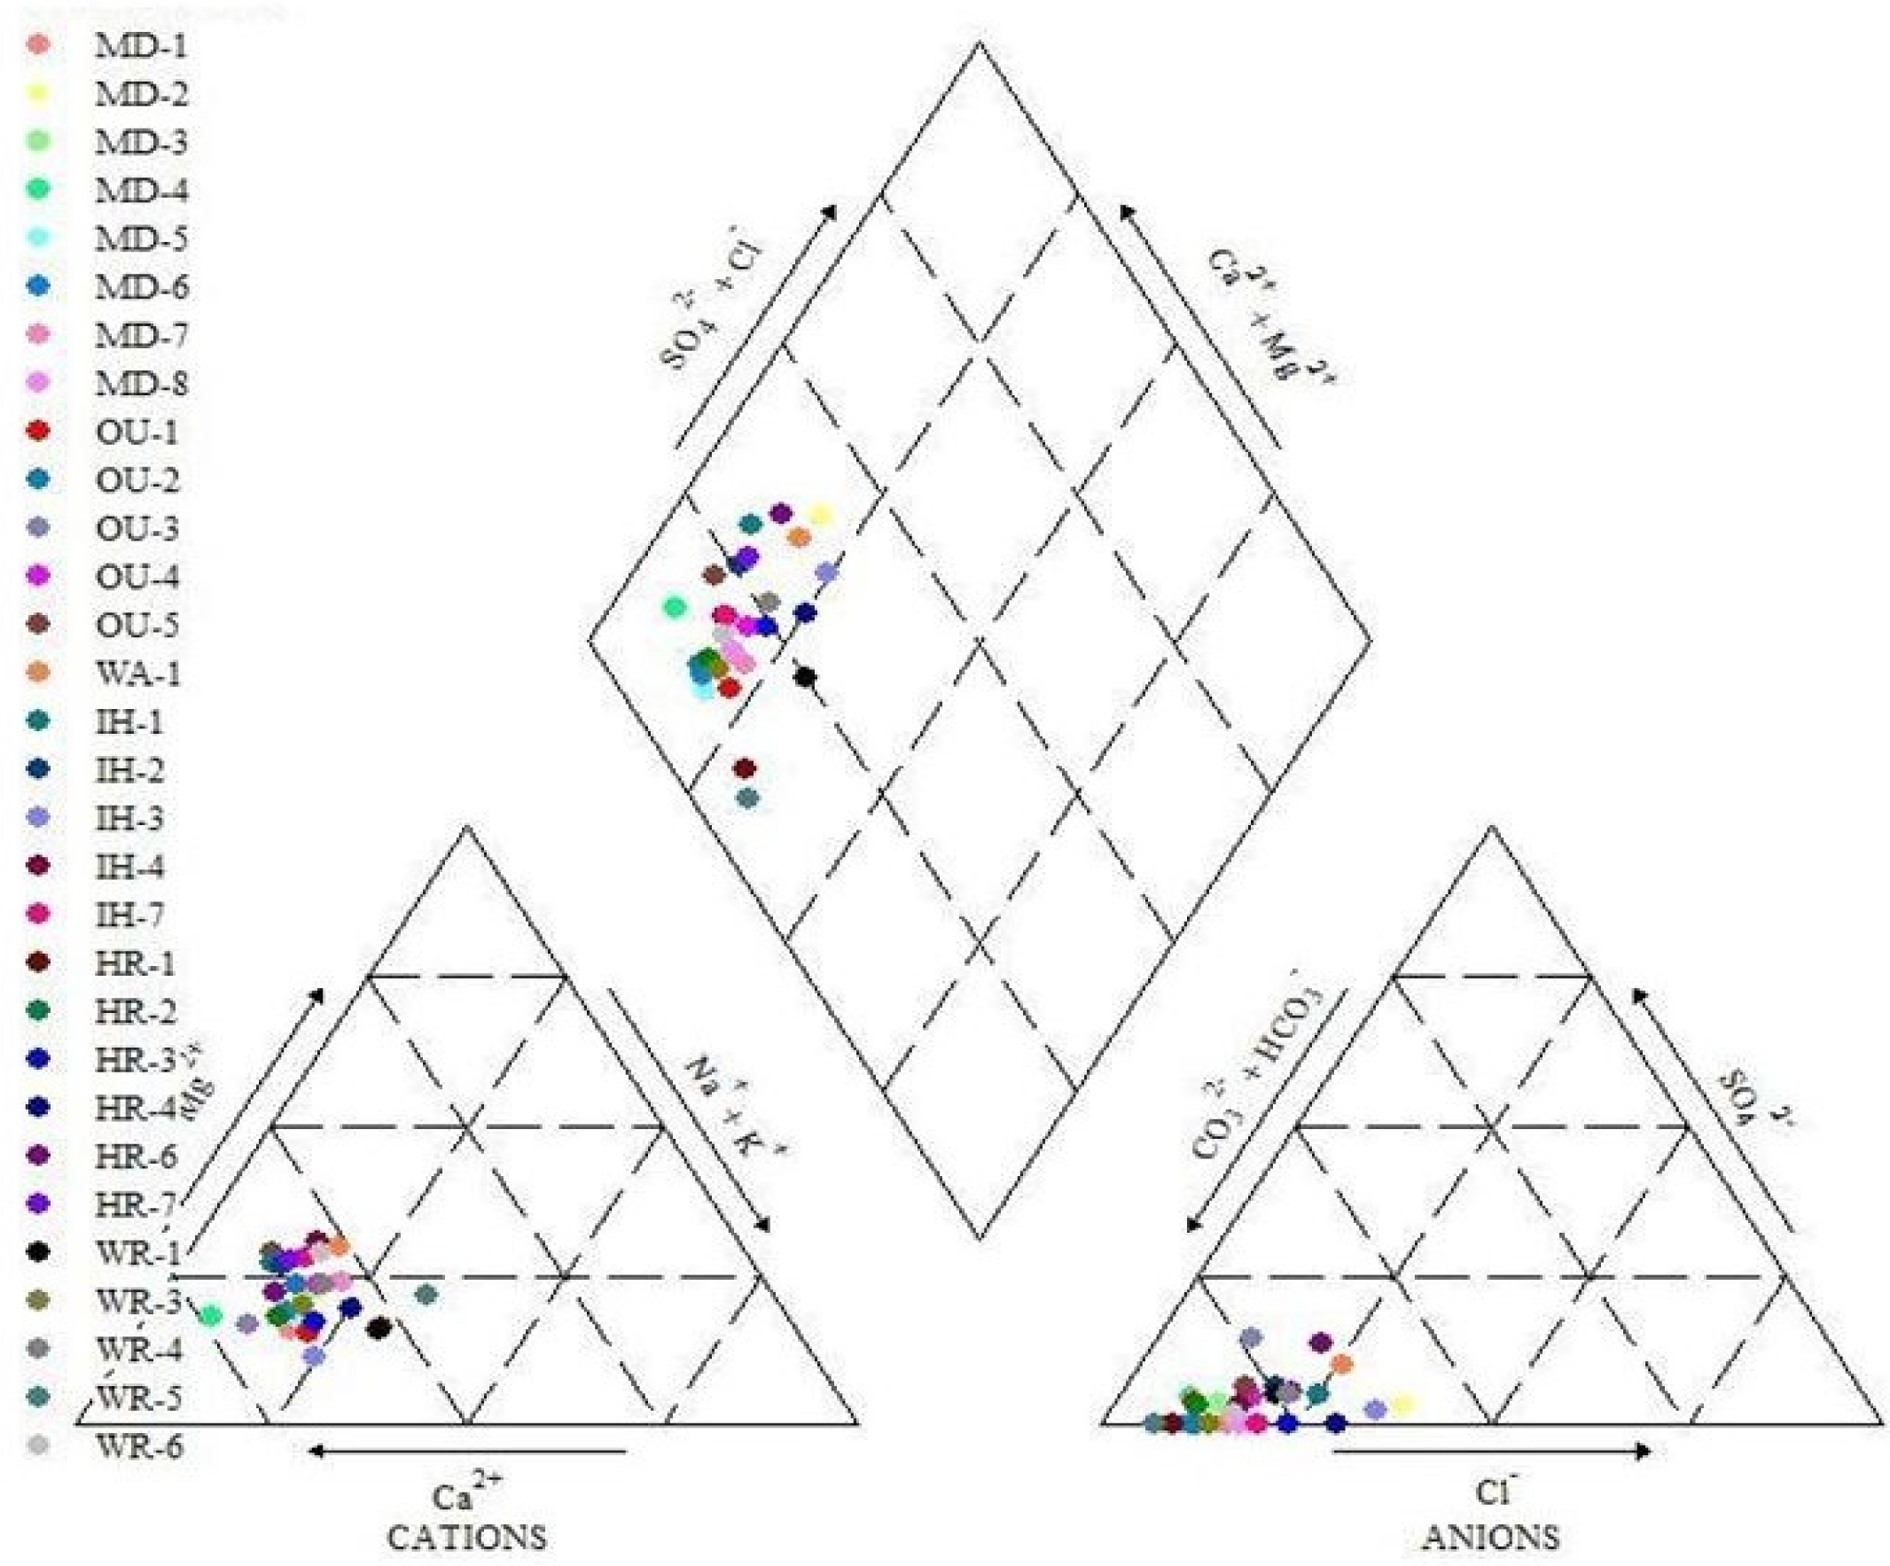
From the results, noticeable concentrations difference between rockbed and alluvial water were not identified. And from groundwater type analysis using the piper dia-gram, all water type was identified to be Ca2+-HCO3− that implies typical type of fresh water (Fig. 1).
3.3. Assesment of nitrate nitrogen
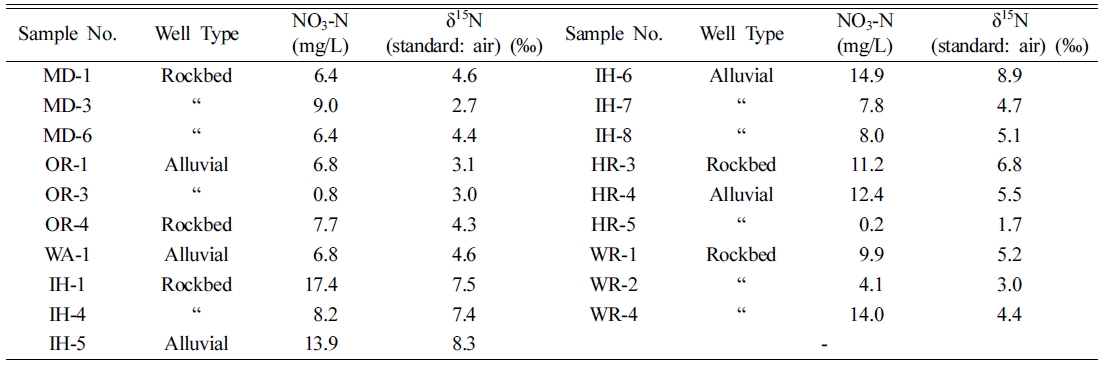
The results of NO3-N and δ15N analysis from 11 rockbed and 8 alluvial water samples were summarized in Table 4. The ranges and average values of NO3-N and δ15N were 0.2~17.4 mg/L and 8.7 mg/L and 1.7~8.9‰, and 5.0‰, respectively. The averages of NO3-N and δ15N in rockbed and alluvial water were 8.7 mg/L and 4.7‰ and 8.8 mg/L and 5.4‰, and noticeable difference between them was not found.
The origins of nitrate nitrogen by chemical fertilizer, live-stock manure and domestic sewage, and natural soil were summarized in Table 5.
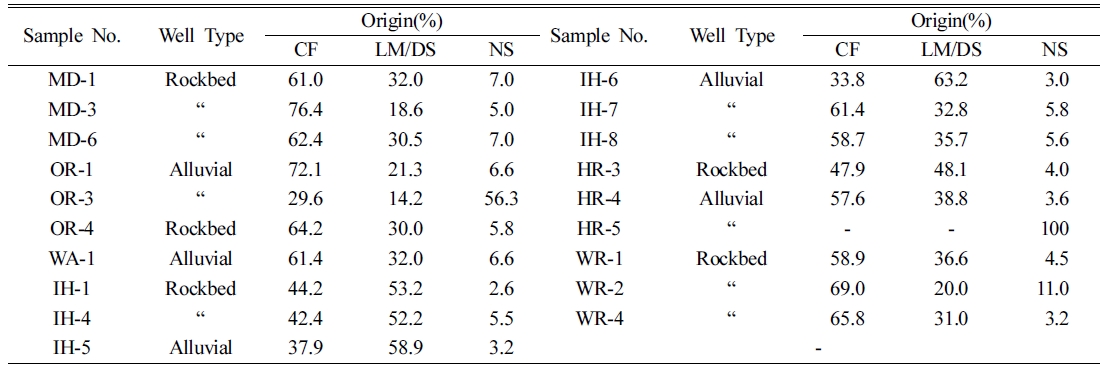
The results of 56.3% at OR-3 and 100% at HR-5 were evaluated. Distinctly lower NO3-N concentrations of 0.8 mg/L and 0.2 mg/L from two samples were noticed. It is presumed that NO3-N can be originated by natural soil. Careful consideration, hence, is necessary for evaluating the origin of nitrate nitrogen. The ranges of nitrate origins by chemical fertilizer, livestock manure and domestic sewage, and natural soil are 29.6~76.4%, 14.2~58.9% and 2.6~ 7.0%, and the average values of those are 57.4%, 37.4% and 5.3%, respectively except from OR-3 and HR-5. Regarding origin of nitrate nitrogen, chemical fertilizer affects more than livestock manure and domestic sewage, and natural soil. And the average values of nitrogen origin by chemical fertilizer, livestock manure and domestic sew-age, and natural soil in rockbed samples were 60.2%, 34.3% and 5.5%, and those of alluvial samples were 53.2%, 41.7% and 5.0%, respectively. It is noted that chemical fer-tilizer affects origin of nitrate nitrogen more in rockbed water than alluvial water, while less affects by livestock manure and domestic sewage.
4. Conclusions
pH range and average value were 6.00~7.12 and 6.76, and those of electric conductivity (EC) were 46~398 μS/cm and 237 μS/cm. pH and EC measurements between rock-bed and alluvial water were not significant. From the results of general item analysis, total colony counts were detected 11 out of 20 samples, and average value of was 31.73 CFU/ ml. And the total coliforms were counted in 3 out of 20 samples. The ranges of NO3-N concentrations was 0.9~24.0 mg/L, and the average value was 8.3 mg/L. And average NO3-N values of rockbed and alluvial water were 7.9 mg/L and 10.6 mg/L, respectively. In general, noticeable results were not found between rockbed and alluvial water. From the ion analysis, noticeable concentrations difference between rockbed and alluvial water was not identified. And from groundwater type analysis using the piper diagram, all water types were identified to be Ca2+-HCO − that implies typical type of fresh water. The ranges and average values of NO3-N were 0.2~17.4 mg/L and 8.7 mg/L, and those val-ues of δ15N were 1.7~8.9‰, and 5.0‰. The averages of NO3-N and δ15N in rockbed and alluvial water were 8.7 mg/ L and 4.7‰ and 8.8 mg/L and 5.4‰, respectively, and noticeable difference between them was not found. The results of 56.3% of δ N at OR-3 (NO3-N 0.8 mg/L) and 100% at HR-5 (NO3-N 0.2 mg/L) were evaluated. It is sup-posed that distinctly lower NO3-N concentrations can be caused by natural soil rather than the other factors. Careful consideration, hence, is required for evaluating the origin of nitrate nitrogen. The ranges of nitrate origins by chemical fertilizer, livestock manure and domestic sewage, and natu-ral soil were 29.6~76.4%, 14.2~58.9% and 2.6~7.0%, and the average values of those were 57.4%, 37.4% and 5.3%, respectively. Chemical fertilizer affects origin of nitrate nitrogen more than the other origins. Rockbed water are more affected by chemical fertilizer than alluvial water, while less affected by livestock manure and domestic sew-age. The study can be referenced for basic data and future researches for monitoring and management of groundwater quality in the region.

